Contrary to a shameful editorial heading in yesterday’s Reading Chronicle, there were NOT “Thousands of Reading students excluded for violence”.
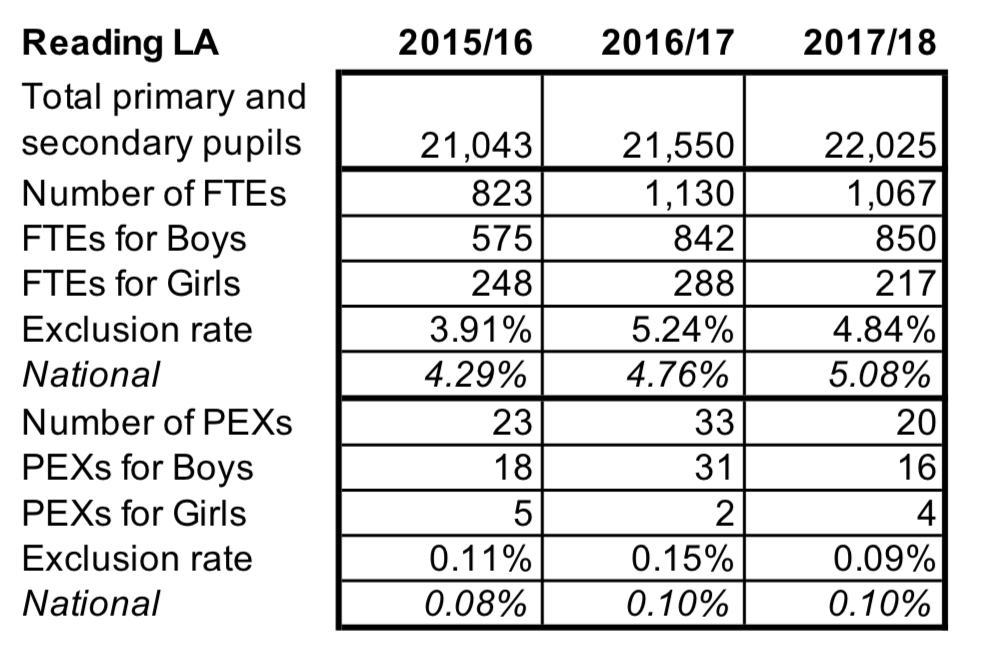
Despite the Chronicle’s claim that “MORE than 3,000 students in Reading were excluded between 2015/16 – 2017/18 for violence and/or drug and alcohol issues.”, this is simply not true. There were 3,096 exclusions over the 3 years (for a variety of reasons), but as a pupil can receive more than one exclusion over 3 years, the number of actual pupils will be much lower. Research of the data published by the Department for Education shows that the number of pupils actually excluded over these 3 years are 444 [2015/16], 553 [2016/17] and 501 [2017/18]. Again, to simply add these together would be misleading, as it is likely that some pupils will be have been excluded in more than one of these years.
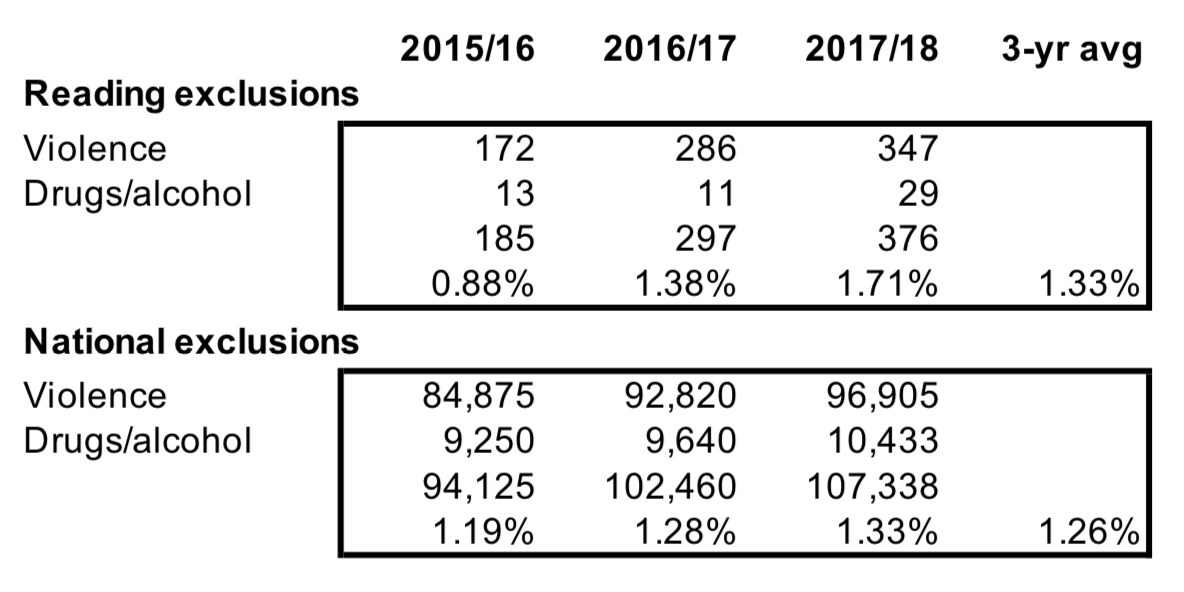
The next claim by the Chronicle was that all of these exclusions were for violence and/or drug and alcohol issues. This is a clear example of fake news, and furthermore, contradicts the information in the actual written article, although this, too, was inaccurate. Exclusions are analysed between 12 categories, of which only 3 report violence and drugs/alcohol. Again, the DfE only publishes the number of exclusions by category, not the number of pupils, so it is not possible to determine how many pupils were excluded for violence or drugs/alcohol. There may be a number of pupils involved in one assault, and unfortunately, there may be more than one incidence of assault by a pupil over time. Exclusions over this 3 year period for violence or drugs/alcohol totalled 858. Is this high? It’s obviously not a good indictment of our society, but is not significantly different from the national average over this period (1.26% vs Reading 1.33%). Meanwhile, this week the national press is reporting record highs of assault on police, NHS, fire and prison service personnel, claiming that 200,000 emergency service workers were attacked in 2019. Does a higher exclusion rate for violence indicate that schools are more violent, or does it indicate that violence is being treated promptly and with due seriousness?
So what can we conclude? Exclusions, and the number of pupils excluded, rose between 2015/16 and 2016/17, falling in 2017/18. Meanwhile the population of Reading pupils has continued to grow year on year, so that the exclusion rate has fallen, and is now below national average for both permanent and fixed term exclusions. The underlying reasons behind the data remain very complex however, and are affected by such issues as changes in behaviour policy, often as a result of changes to school organisation/ownership, effectiveness of dealing with low-level behaviour, staffing levels and morale, the amount of space available outside the mainstream classrooms, off-rolling, differing levels of inclusivity between institutions, and availability of alternative provision locally.
Or perhaps the only thing that we can conclude is that newspaper editors should be more accountable for their glaring errors?
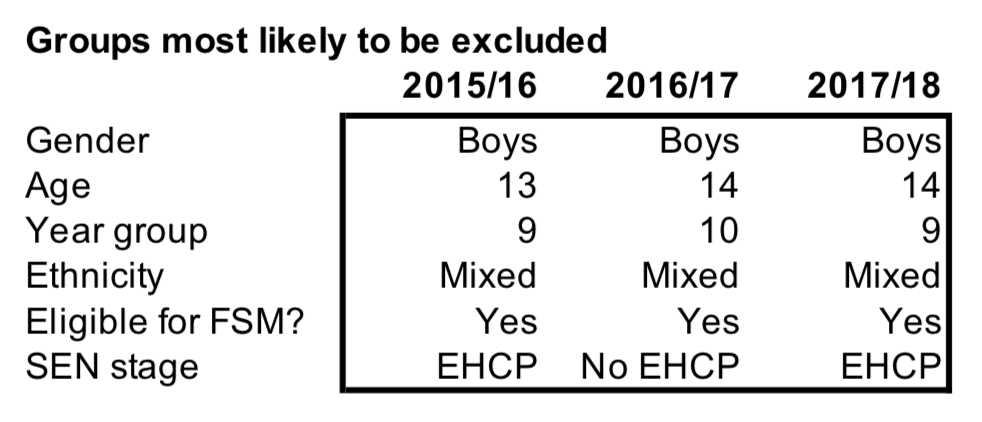
The data used for this article comes from the Department for Education. You may find the following tables of interest.